Walkthrough
This part will walk the user through the usage of Isoplot. There are 2 ways to use the tool: through a GUI hosted on a Jupyter Notebook or through a Command Line Interface (CLI).
Jupyter Notebook GUI
Once Isoplot is installed and the interactive notebook file isoplot.ipynb is downloaded and placed in the desired directory, launch Jupyter Notebook through the Anaconda Launcher or through the command line.
Note
The Isoplot Notebook interface outputs the created directories and files in the directory where the notebook is contained
Once in the Notebook, navigate to the appropriate folder and open isoplot.ipynb

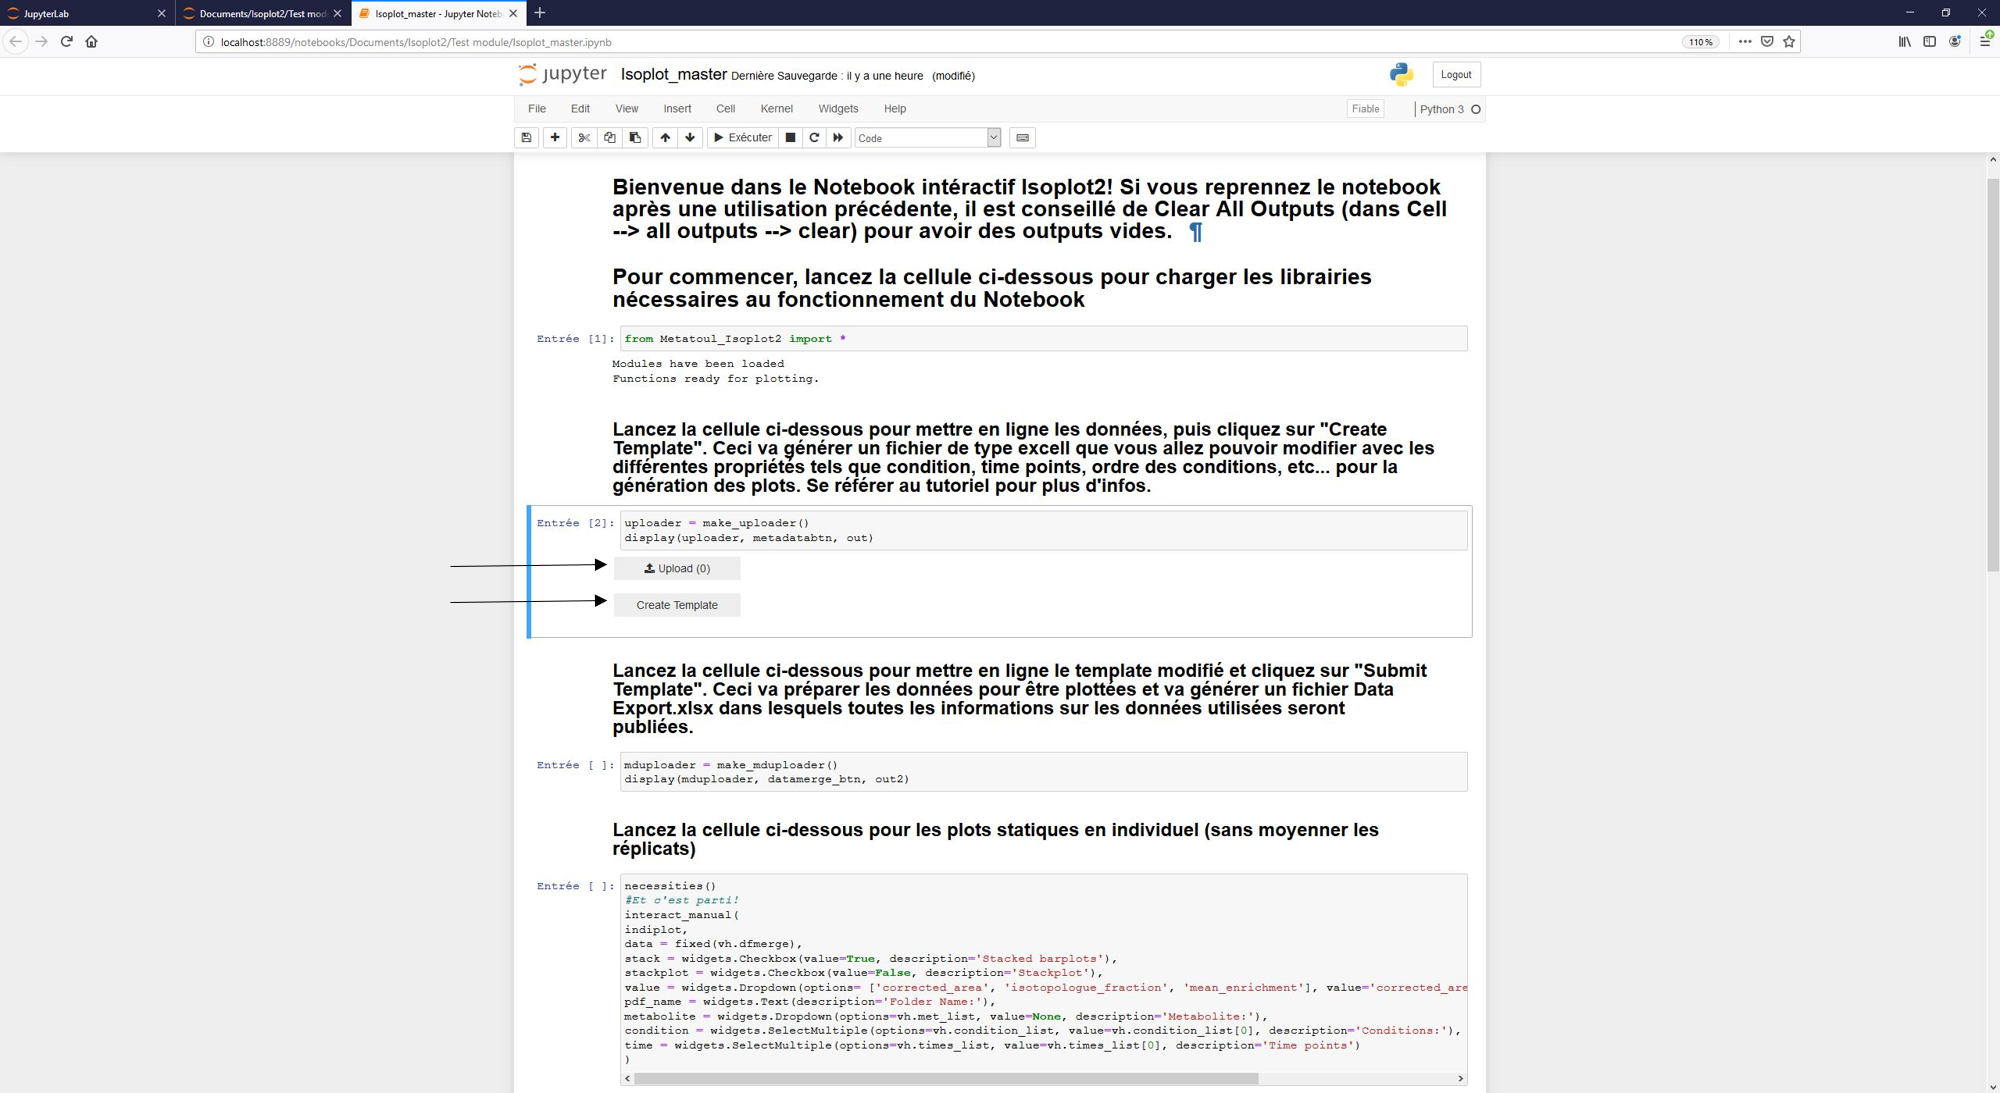
Next, select the first cell and execute it.

Once the buttons have appeared, use the first one to select the datafile and then the second one to submit it.
In the file explorer, navigate to the generated ModifyThis.xlsx template file and open it.

Fill the file with your conditions, times, replicate numbers, etc… then save it.
Warning
What you input here will be used by Isoplot to generate the groups for plotting (ex: condition AB at T0 replicate 1). If you have multiple replicates for one same time and condition, number them starting from 1.

The ModifyThis.xlsx file contains a table with 5 columns. They are detailed in Tutorial - Template file. Once you have finished modifying the template, save it.
Note
It is good practice to change the name of the template file because if you press the “create template” button once more Isoplot will overwrite the old ModifyThis.xlsx file.
Example of finished template file:

Next step is to launch the next cell to generate the buttons to upload and submit the template. Once this is done you can start plotting your figures!
